Here are 5 common photography questions and answers for beginners.
How to Avoid Blurry Images?

Photo Credit : Arjun Purkayastha
Here are a few tricks to avoid taking blurry photos.
Use the correct shutter speed. A simple rule of thumb suggests that the longest possible shutter speed you can allow—and still avoid blur while taking a free-hand photograph—depends on the focal length of your lens. If you’re using a 50 mm lens, the maximum shutter speed is approximately Image 1/50 s; if you’re using a 100 mm lens, it’s about Image 1/100 s; and so on. (This rule of thumb applies to focal lengths that have been converted to a 35 mm film format.)
Bring a tripod with you. This sounds logical, but many people leave their tripods at home. While they may be heavy and cumbersome, sometimes their weight is exactly what you need. There’s nothing like a heavy, stable tripod to guarantee razor-sharp images.
Use a remote shutter release or the automatic timer functions of your camera in combination with a tripod. These measures will ensure that your camera won’t shake during the exposure.
Understanding Image Size and Resolution
Image size and resolution are stated in different and often confusing units. Here is a quick overview of the commonly used naming systems and labels:
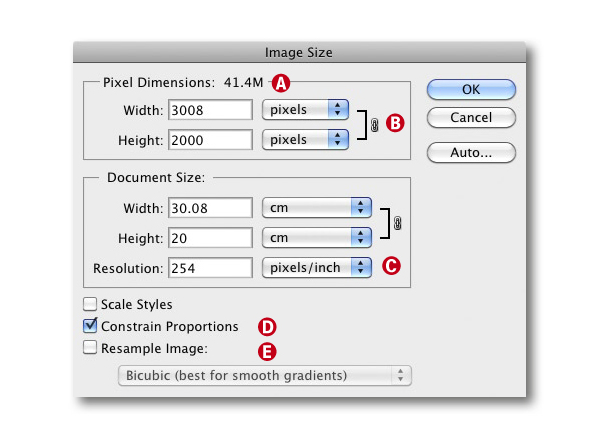
- File Size depends on the format and compression rate you use to save your image. File size is stated in KB or MB. The image in above figure is a compressed TIFF at about 41.4 MB. The same image requires about 15 MB of disk space as a compressed JPEG. File size can vary enormously!
- Image Size in Pixels is stated using the height and width of the image as it is captured by the camera. A Nikon D70 produces images measuring 3008 × 2000 pixels (i.e., 6.1 million pixels, or 6 megapixels). The rule of thumb here is: “more is better”.
- Resolutionis stated in pixels per inch (ppi). An uncropped photo print shot using a Nikon D70 and printed at 300 ppi results in a print size of:
- 3008/300 × 2000/300 = 10.02″ × 6.66″ (24.46 cm × 16.93 cm)
- If you print the same image on an inkjet printer at 180 ppi, the image size would be: 3008/240 × 2000/240 = 12.53″ × 8.33″ (31.83 cm × 21.17 cm)
- Printers (and other output devices) have resolution that is stated in (ink) dots per inch (dpi). Inkjet printer resolution is typically between 1400 and 5760 dpi. However, inkjet printers simulate halftones using closely grouped collections of extremely small dots and thus print many fewer dots (180–300 ppi) than the image actually has. We therefore recommend that you print on inkjet printers at resolutions between 180 and 360 dpi. The correct input resolution (in ppi) depends on the type of output device you are using.
- Pre-press applications still use the lines per inch (lpi) unit.
- Monitors have a resolution of between 72 and 100 pixels per inch (72–100 ppi).
- Constrain Proportions: Always use this option if you want to avoid skewing your image.
- Resample Image: This option is used to produce larger or smaller versions of your image, but causes image quality loss in the process – especially if you enlarge your image. Resampling changes the number of pixels in your image. If you deactivate resampling, the image data remains unchanged, and only the physical output size (of your print, for example) changes.
What is a Rule of Third?

Image Credit : Drazen Tomic
The rule of thirds is a compositional rule of thumb in visual arts such as painting, photography and design. The rule states that an image should be imagined as divided into nine equal parts by two equally-spaced horizontal lines and two equally-spaced vertical lines, and that important compositional elements should be placed along these lines or their intersections. Proponents of the technique claim that aligning a subject with these points creates more tension, energy and interest in the composition than simply centering the subject would.
The photograph to the right demonstrates the application of the rule of thirds. The horizon sits at the horizontal line dividing the lower third of the photo from the upper two-thirds. The tree sits at the intersection of two lines, sometimes called a power point or a crash point. Points of interest in the photo don’t have to actually touch one of these lines to take advantage of the rule of thirds. For example, the brightest part of the sky near the horizon where the sun recently set does not fall directly on one of the lines, but does fall near the intersection of two of the lines, close enough to take advantage of the rule.
Understanding LAB Color
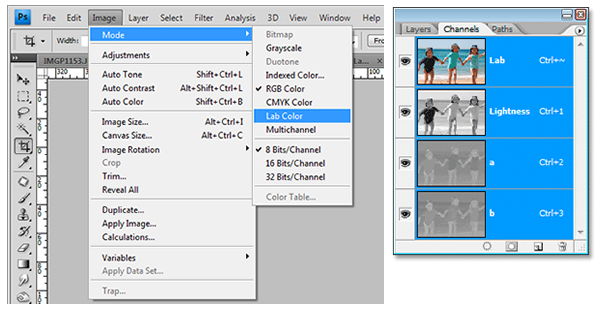
Lab Color is device independent—sort of. It is independent of the kind of information that peripheral devices, such as monitors, scanners, and digital cameras use to describe color. But in fact, it is directly related to the most perfect optical device of all — the human eye. Lab Color is used to describe the complete range of colors that humans can see.
The three color channels in Lab images divide the information into an L channel, which contains brightness information and two color channels — A and B
- The L channel has 100 possible values from 0, which indicates, black to 100, which equals white.
- The A channel is composed of magenta and green. Negative values which range from 128 to −1 indicate green and positive values between 0 and 127 indicate magenta.
- The B channel is composed of yellow and blue. Negative values between −128 and −1 indicate blue and positive values between 0 and 127 indicate yellow.
Having access to the lightness information separate from the color information enables you to control each independently. With the creative use of these channels, you can take your images to a whole new level.
What is a Histogram?

Histograms are useful in determining the exposure of the captured image. A histogram is simply a graphical representation that shows how many pixels in your image fall between absolute black and pure white.
Being able to read a histogram correctly is important when shooting because it gives you a true representation of what the camera’s sensor recorded. Each camera displays the histogram a little differently, but the basic information is the same. Some cameras also show separate histograms for each color channel of red, green, and blue as well as a overall representation of the image. The histogram lets you know immediately if the image data falls into the range that your camera’s sensor can capture.
Like the article? Be sure to subscribe to our RSS feed, follow us on Twitter and Facebook to stay up on recent content.

4 comments
Very Nice info.. Image Size and Resolution very useful for me.
Great Info. TFS.
I’m so glad i came across ur site..i’ve just started and am loving it…ur site would surely make things easier for me ! Thanks a lot !!!
very nice questions & Answers, very useful for the beginners thank to this things are very very nice hats of you